Avg. 6 min read
 Pages Analytics
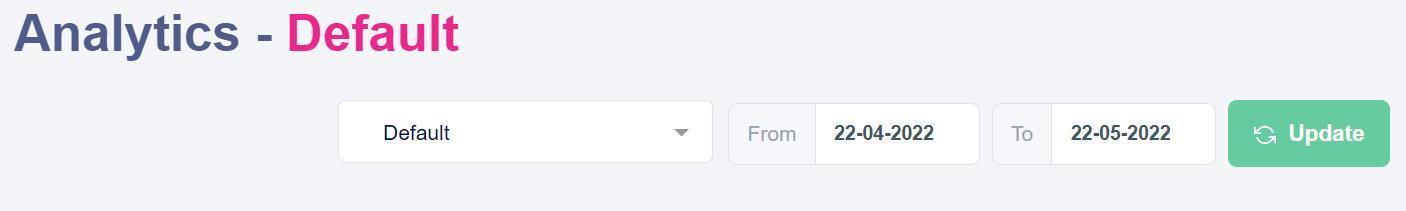
Overall Pages Analytics
Pages Analytics provides actionable insights into the popularity, trends, and performance of your Category and Brand Pages.
Select a category or brand page to analyze, and set the time period you want.
The dashboard is divided into sections, each focusing on a specific metric:
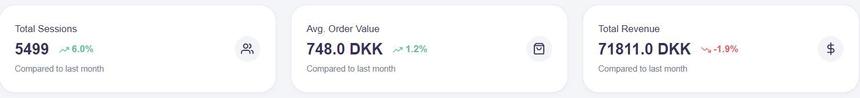
Total Sessions
Displays the number of sessions on the selected category or brand page, compared to the previous period.
A session is a period during which a visitor performs actions on your webshop. The default session timeout is 30 minutes of inactivity, which you can adjust. Each interaction (for example, clicking a product, changing filters, or moving to the next page) resets the timer to 30 minutes.
A session ends when 30 minutes pass without interaction, at midnight local time, or when a visitor returns via a different campaign. A single user can start multiple sessions.
Non-interaction sessions are excluded from counts. The exception is a first session for a new user, which is counted even if it contains no interaction.
Average Order Value
Shows the average revenue per order for the selected period and page, based on all orders attributed to that page.
Total Revenue
Shows total revenue attributed to the selected page for the specified period.
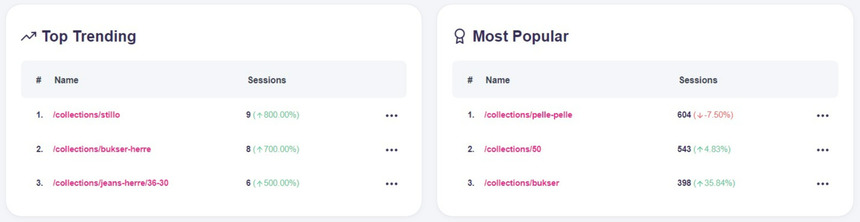
Top Trending
This section highlights category or brand pages with increasing demand and revenue in the selected period.
Top Trending shows the top three pages with their session counts and the percentage change compared to the previous period.
Note
Monitoring trending categories and brands helps align inventory and campaigns with seasonal patterns, releases, and events to meet demand during peak periods.
Most Popular
Shows pages with the highest number of sessions, indicating strong browsing interest. Use this to identify the pages your customers visit most.
Note
If a popular page has low conversion, analyze where users drop off. Check assortment, availability, sizes, colors, pricing, and page experience to improve conversion.
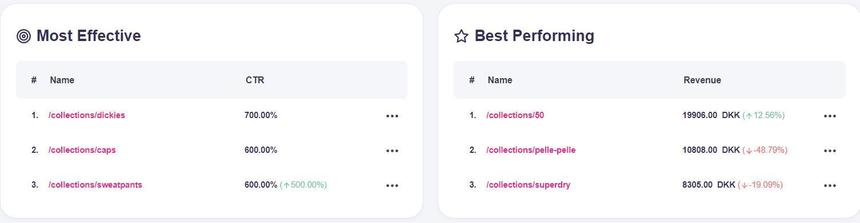
Most effective
Shows pages with the highest click-through rate (CTR). CTR is the ratio of product clicks to total impressions on the page.
Note
A high CTR with a low conversion rate (CR) often indicates a product mismatch or friction later in the journey. Validate variants, sizes, colors, pricing, and availability.
Best Performing
Shows the pages generating the highest revenue and the total attributed revenue for each.
Note
Tracking top revenue-driving pages over time helps anticipate demand shifts and adjust inventory to avoid overstock or missed sales.
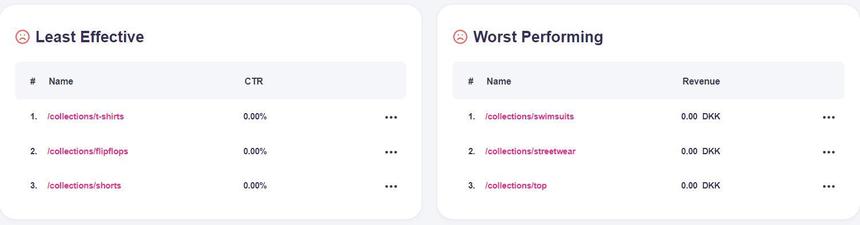
Least Effective
Shows pages with the lowest click-through rate, indicating low engagement with products on those pages.
Note
Use this list to prioritize optimization. Improve content relevance, filters, sorting, and product availability to increase click-through and downstream conversions.
Worst Performing
Shows the pages generating the lowest amount of revenue.
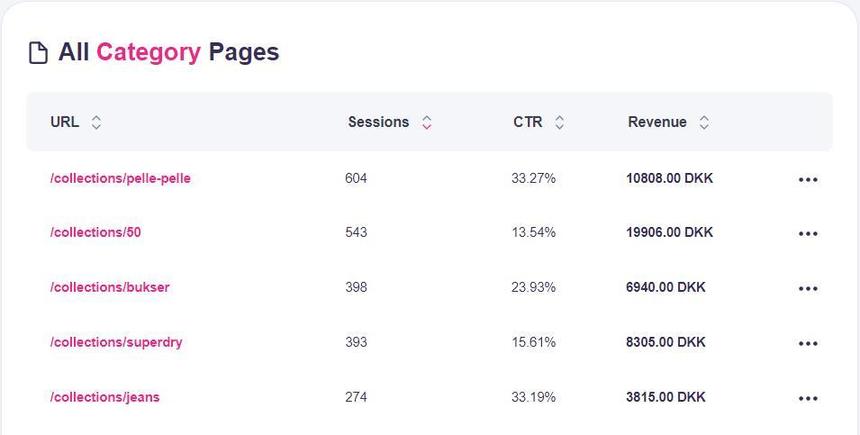
All Category Pages
You can also view all category and brand pages on your webshop. Sort the list by sessions, click-through rate, or revenue.
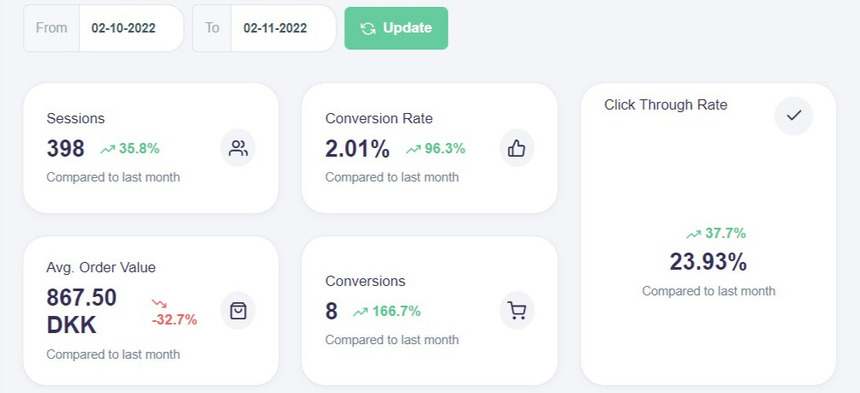
Detailed Pages Analytics
Click any category or brand page in the sections above to open a detailed view with analytics for that specific page.
This is a drill-down version of the Overall Pages Analytics and includes:
Sessions
Number of sessions compared to the previous period.
Conversion Rate
Conversion rate for the selected page. This reflects conversions per session for the chosen period.
Average Order Value
Average revenue per order from products on the selected page within the specified time.
Conversions
Number of purchases attributed to the selected page within the chosen period.
Click-Through Rate
The ratio of impressions that resulted in clicks within the selected page.
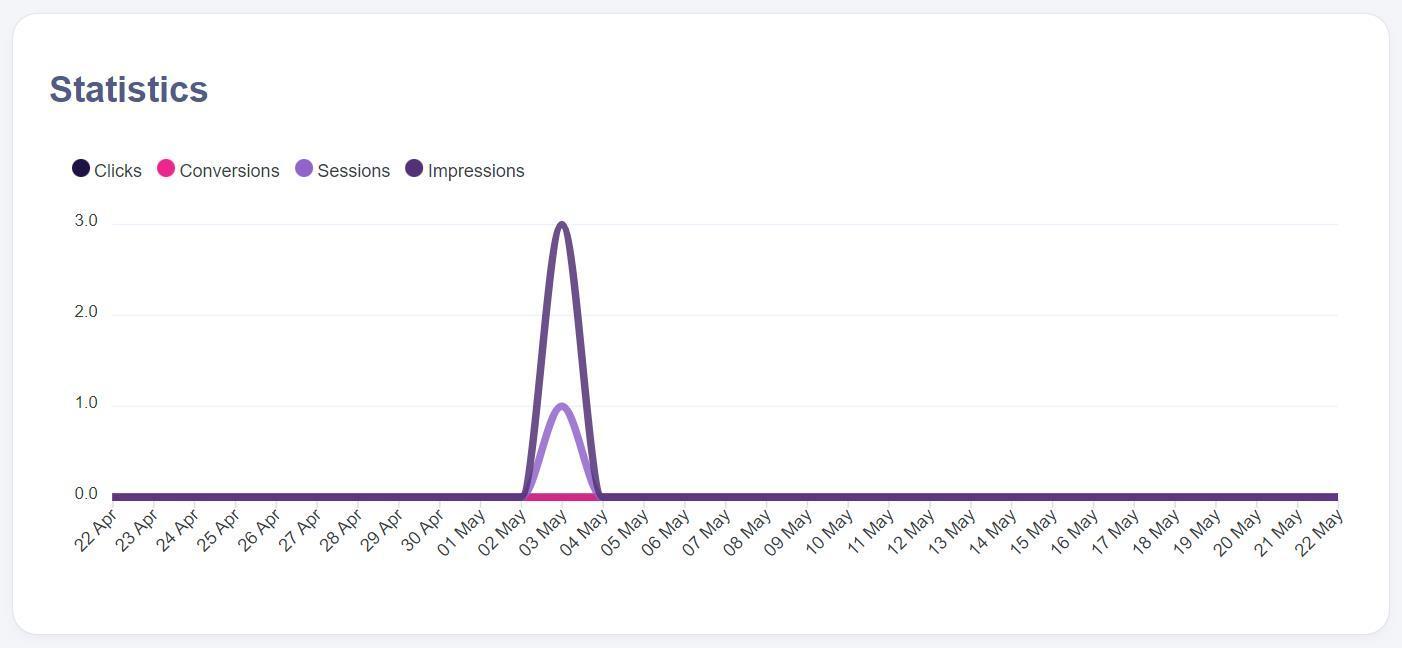
Statistics
A graphical view of the following metrics for the selected time period:
- Number of clicks on products from the selected page
- Conversions attributed to the selected page
- Number of sessions on the selected page
- Number of impressions (views)
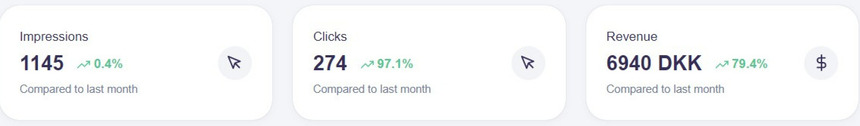
Impressions
Total impressions on the page, including filter applications and pagination (for example, loading more products).
Clicks
Total product clicks within the page.
Revenue
Total revenue attributed to the selected page for the specified period.