Avg. 4 min read
 Search Analytics
The Search Analytics menu gives you actionable insight into how visitors use Hello Retail Search on your site. This guide explains how to read the collected statistics and how to act on gaps in your search setup or product catalog.
Overview
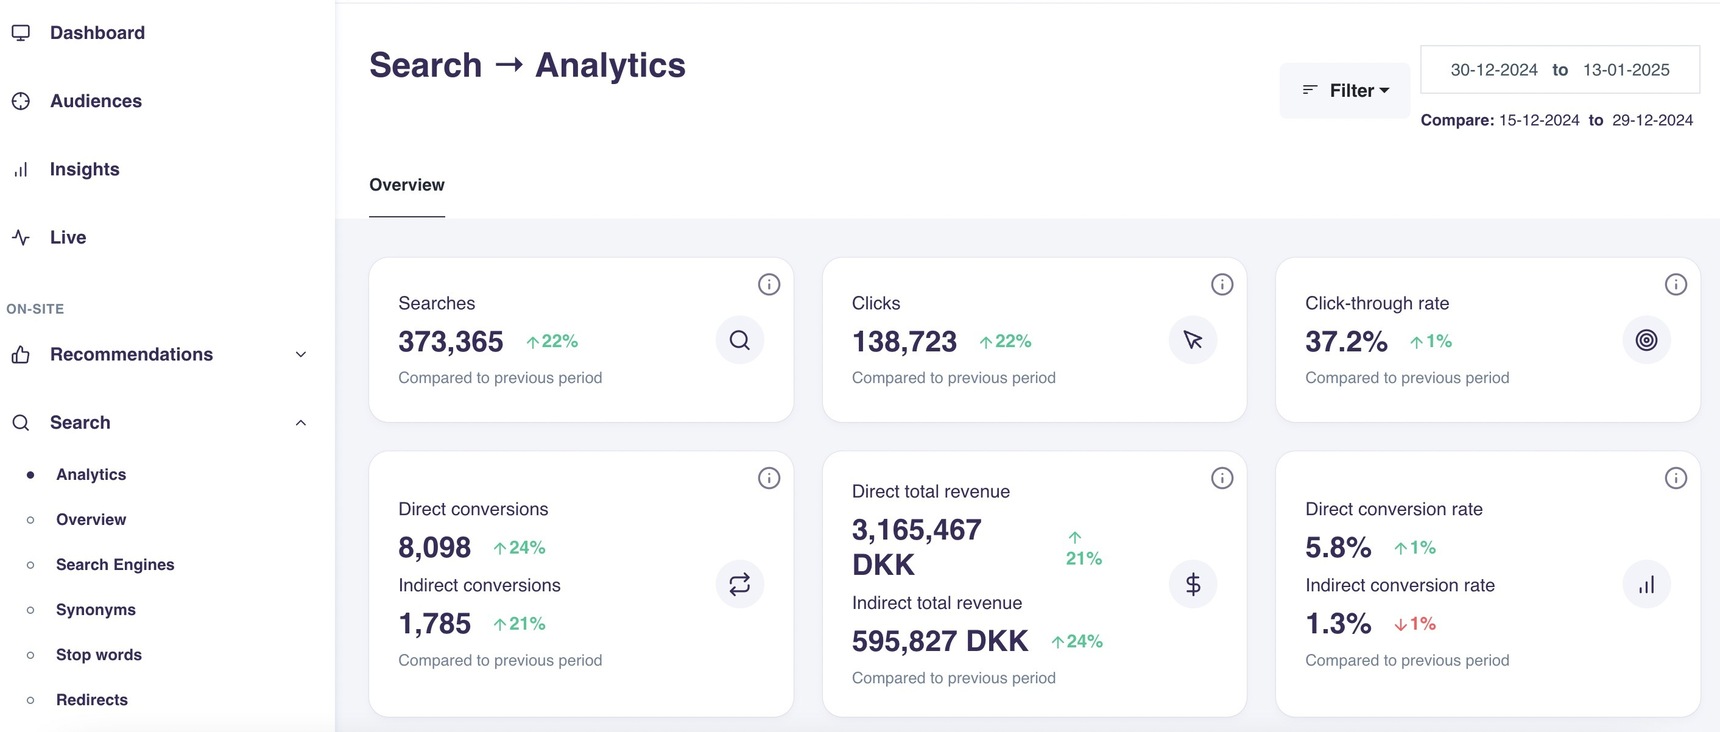
To benchmark sales performance, Hello Retail tracks the average order value and conversion rate of visitors who interact with search and compares them with visitors who do not. You can also compare a current time period with the same period in the past to understand trends. The menu includes an overview of daily searches and clicks generated by your search setup, plus metrics that highlight where search may not be contributing to conversions or order size.
- Start by logging into your Hello Retail account. On the dashboard, open the left-hand menu. Under the On-Site section, click Search to expand the drop-down menu.
- From the drop-down menu, click Analytics.

Note
By default, Search Analytics shows data for the previous 14 days. Use the date selector at the top of the page to change the time range.
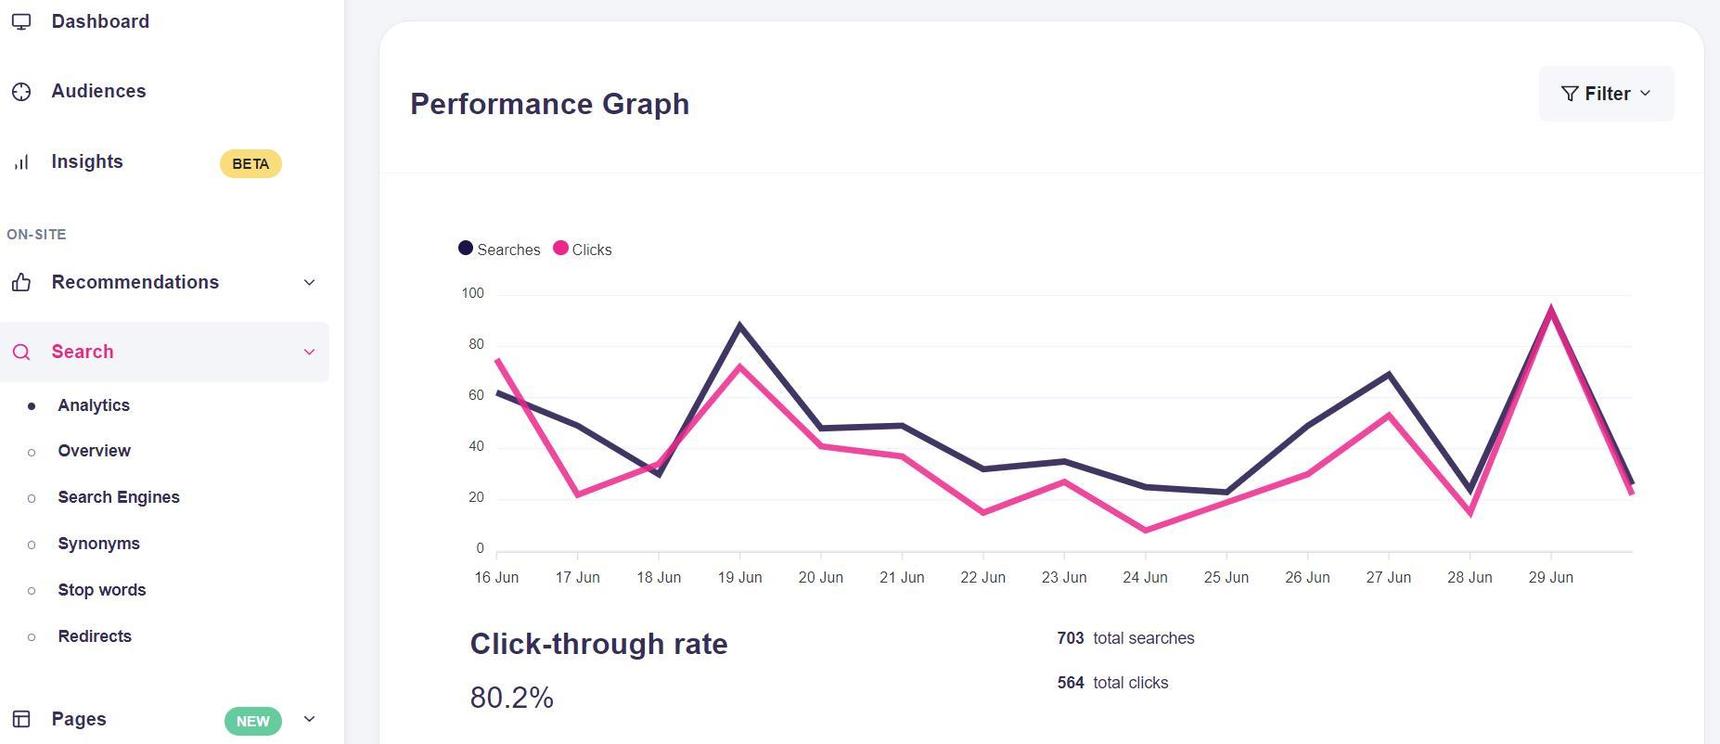
Performance Graph
Use the Performance graph filter to view metrics for a specific search configuration. Click the "Filter" button at the top-right of the graph and select the configuration you want. You can also set a specific start and end date.
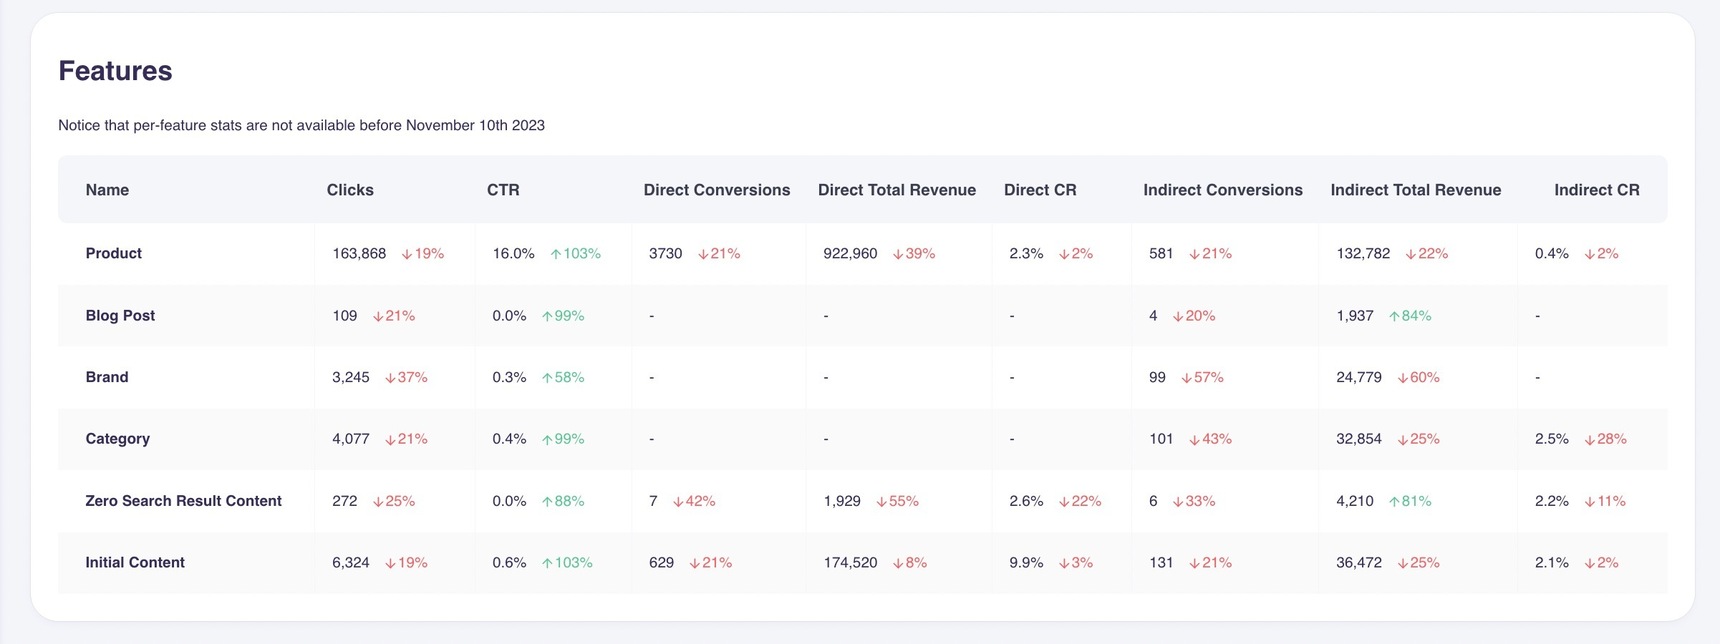
Features
This menu provides a detailed view of interactions with specific content types beyond products, as well as sub-sections of Search such as Initial Content. This helps you understand how individual parts of Search are used.
Top Searches Without Results, Non-Converting Searches and All Searches
In addition to the performance graph, Hello Retail offers views of the individual search terms used by visitors. These are grouped into three sections: Top searches without results, Non-converting Searches, and an overview of all terms.
For all of these views, you can filter metrics by a specific search configuration and export the data to a .csv file.
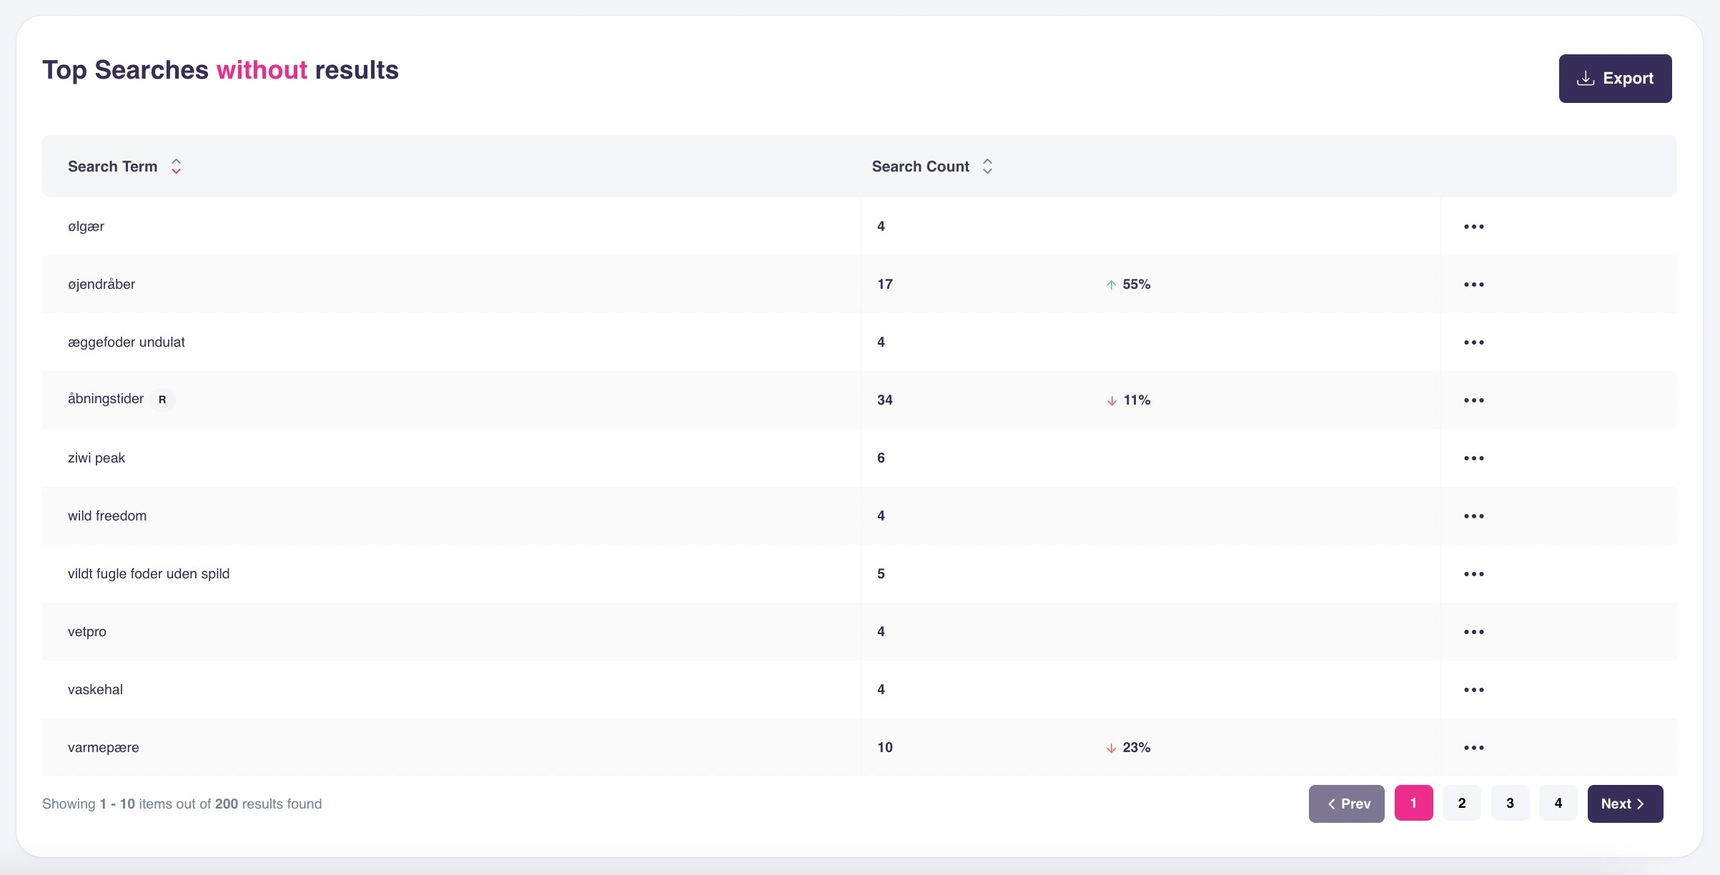
Top Searches Without Results
Top searches without results shows search terms that returned no products or content, along with each term’s search count. From this table, you can create a synonym or a redirect for any listed term.
Non-Converting Searches
This view lists search terms that generate clicks but no conversions. If many visitors use the same queries, click products, and still do not purchase, it could be due to fixable issues. For example, available sizes may not match demand, prices may be higher than competitors, or product images and content may need improvement.
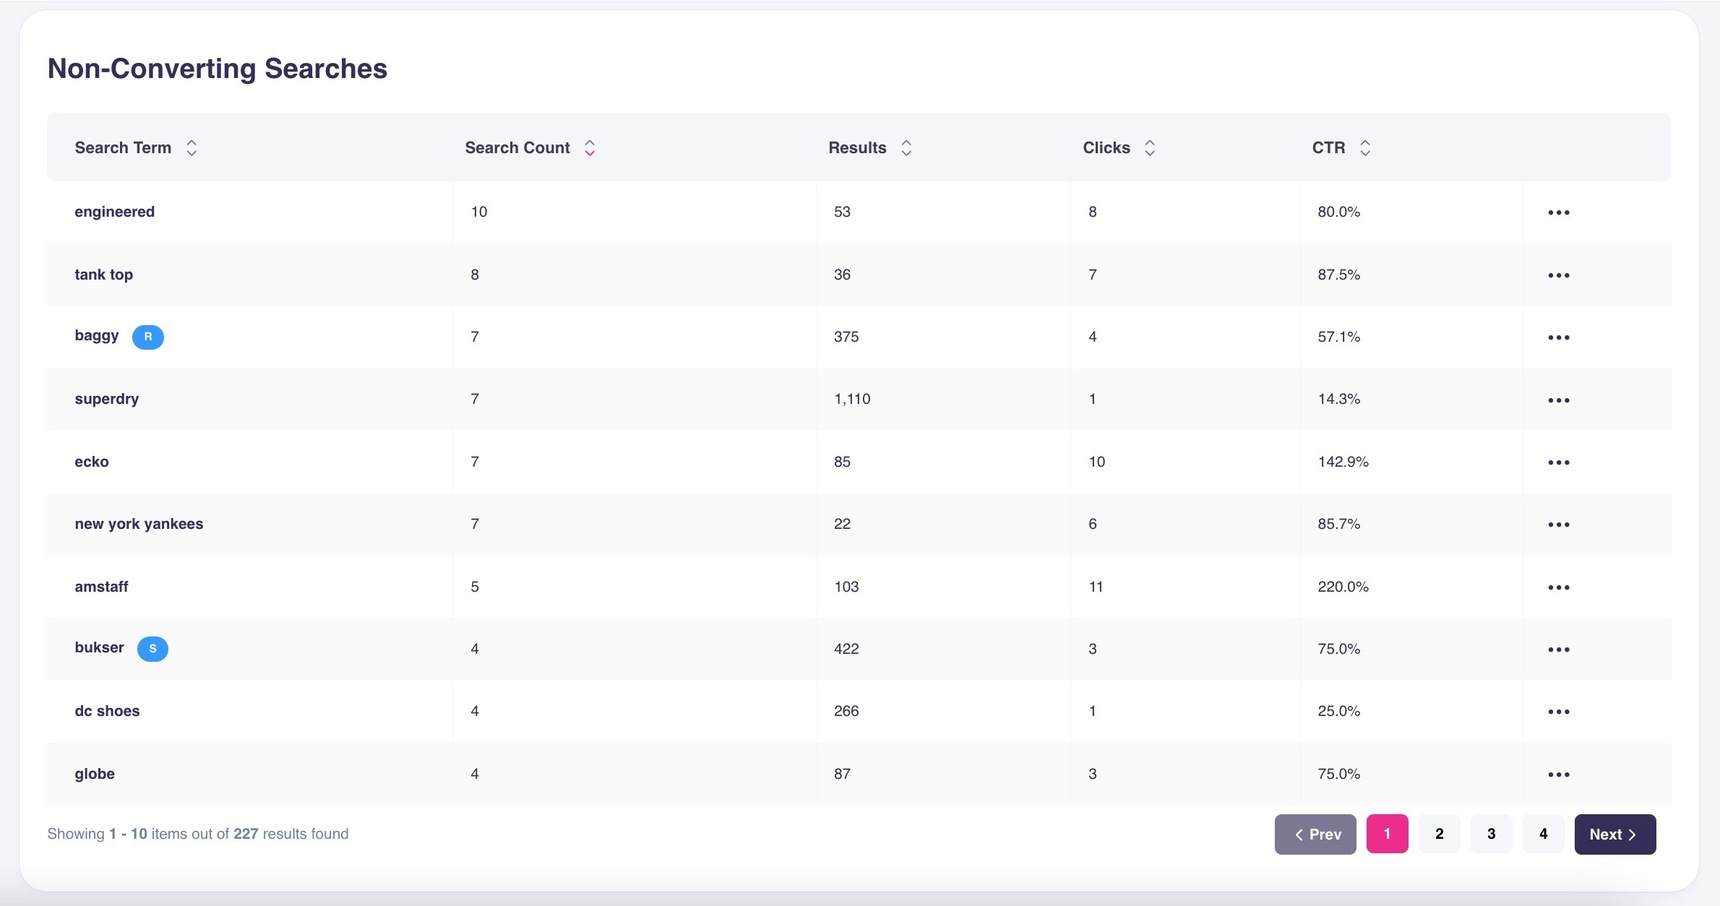
With the most critical searches prioritized by volume, you can quickly identify what needs attention. You can take action by adding Synonyms or Redirects directly in the table.
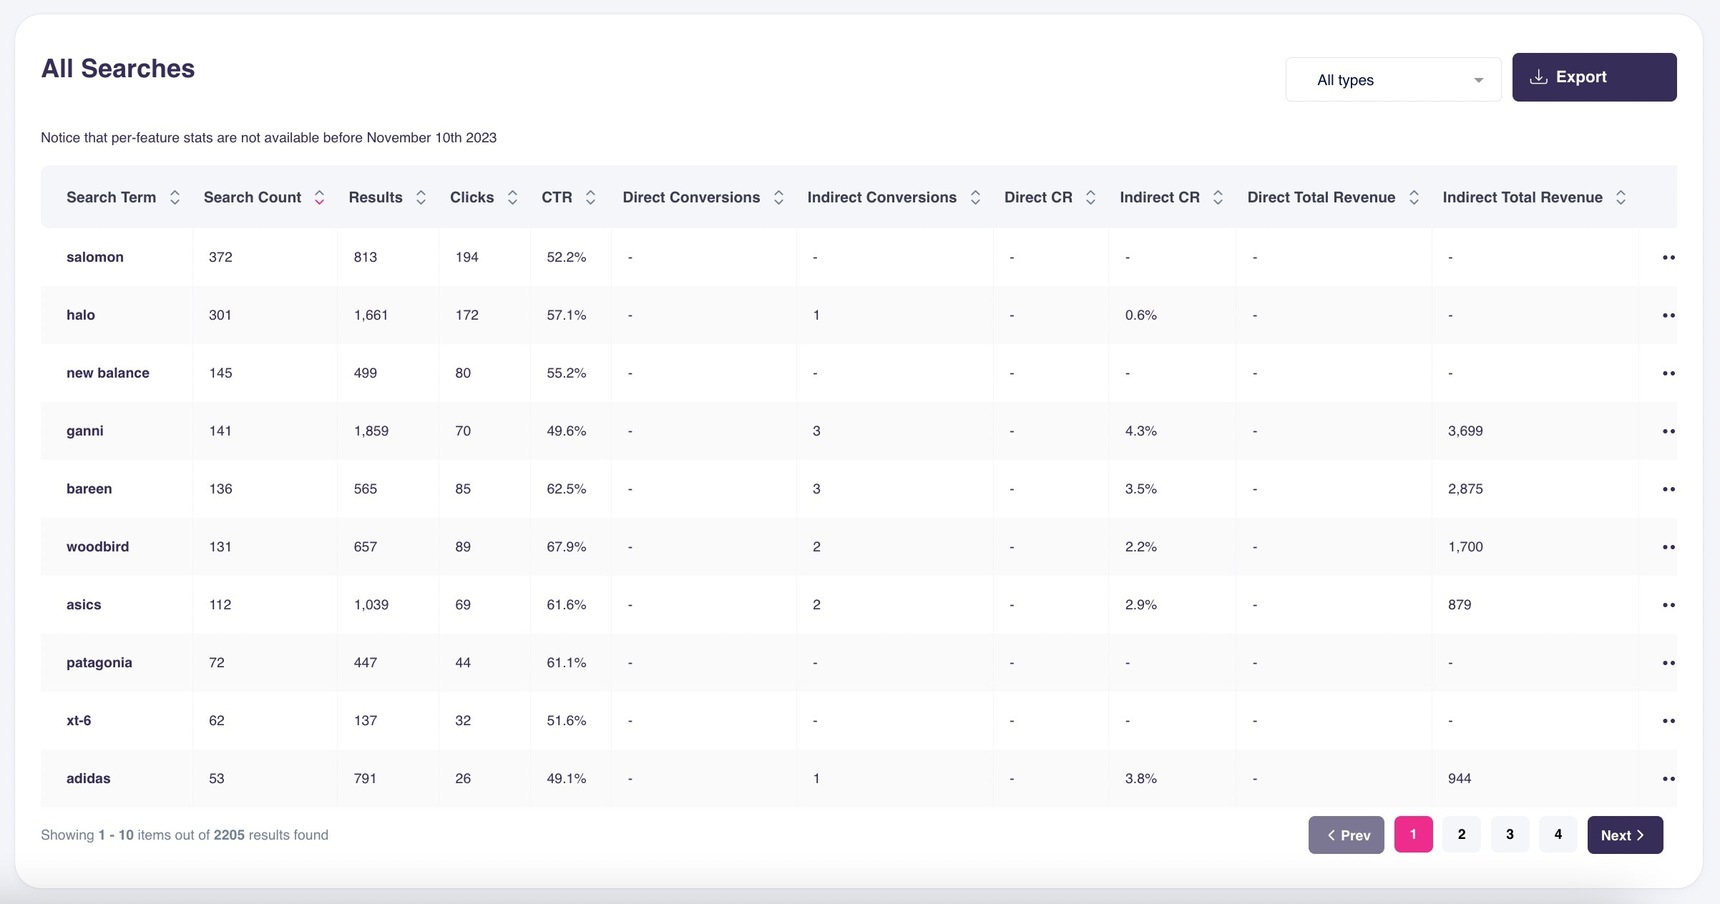
All Searches
These analytics provide more detailed insights into the most popular searches. As shown below, they are broken down into keywords, search count, conversions, conversion rate, and click-through rate to give you a clear performance overview for each term.
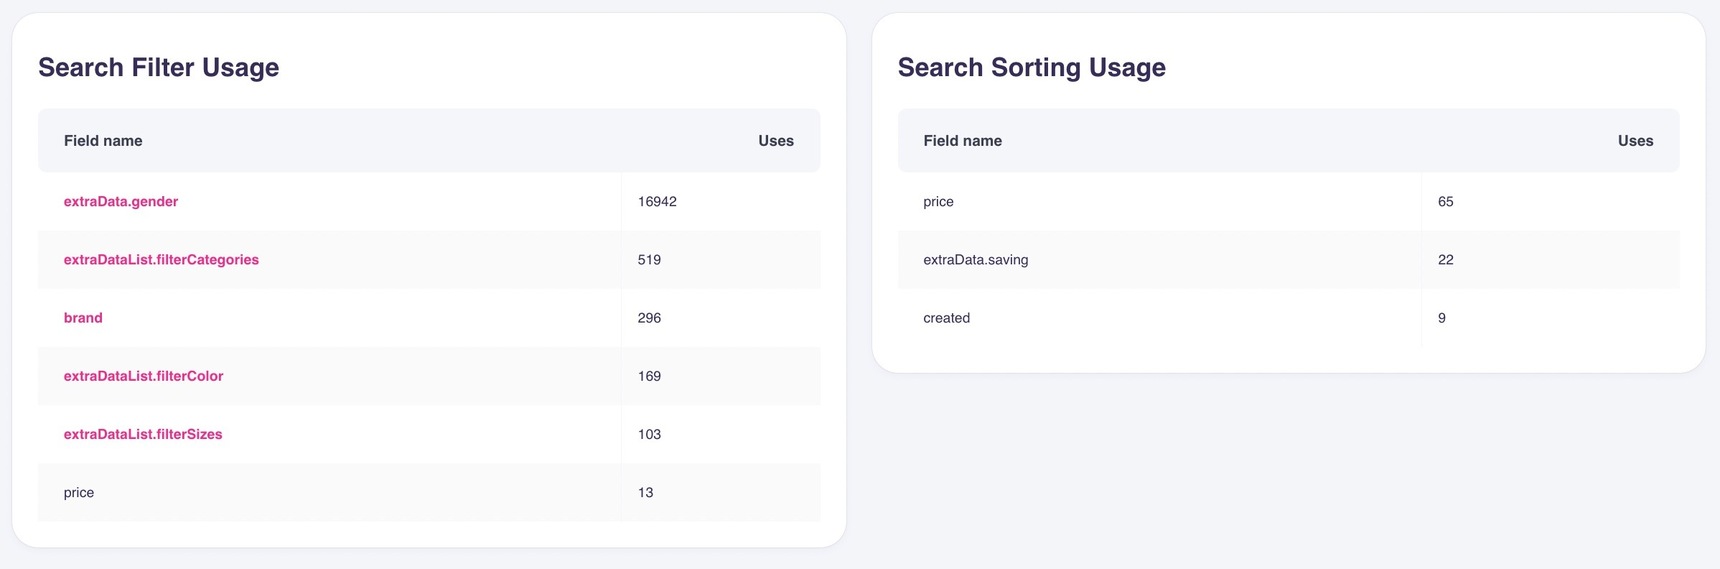
Usage of Filters and Sorting
This section shows how visitors use product Filters and how many use Sort after seeing a list of products, including the preferred order for sorting results.